Linux Kernel vs DPDK: HTTP Performance Showdown

Marc Richards
Discuss on: Hacker News
Overview
In this post I will use a simple HTTP benchmark to do a head-to-head performance comparison between the Linux kernel's network stack, and a kernel-bypass stack powered by DPDK. I will run my tests using Seastar, a C++ framework for building high-performance server applications. Seastar has support for building apps that use either the Linux kernel or DPDK for networking, so it is the perfect framework for this comparison.
I will build on a lot of the ideas and techniques from my previous performance tuning post so it might be worth it to at least read the overview section before continuing.
In Defense of the Kernel
Bypassing the kernel can open up a whole new world of high-throughput and low latency. Depending on who you ask, you might hear that bypassing the kernel will result in a 3-5x performance improvement. However, most of those comparisons are done without much optimization on the kernel side.
The Linux kernel is designed to be fast, but it is also designed to be multi-purpose, so it isn't perfectly optimized for high-speed networking by default. On the other hand, kernel-bypass technologies like DPDK take a single-minded approach to networking performance. An entire network interface is dedicated to a single application, and aggressive busy polling is used to achieve high throughput and low latency. For this post I wanted to see what the performance gap would look like when a finely tuned kernel/application goes head to head with kernel-bypass in a no holds barred fight.
DPDK advocates suggest that bypassing the kernel is necessary because the kernel is "slow", but in reality a lot of DPDK's performance advantages come not from bypassing the kernel, but from enforcing certain constraints. As it turns out, many of these advantages can be achieved while still using the kernel. By turning off some features, turning on others, and tuning the application accordingly, one can achieve performance that approaches kernel-bypass speeds.
Here are a few DPDK strategies that can also be accomplished using the kernel:
- Busy polling (Interrupt moderation + net.core.busy_poll=1)
- Perfect locality (RSS + XPS + SO_REUSEPORT_CBPF)
- Simplified TCP/IP subsystem (Disable iptables/syscall auditing/AF_PACKET sockets)
One advantage that kernel-bypass technologies still have, is that they avoid the syscall overheads that arise from transitioning (and copying data) back and forth between user-land and the kernel. So DPDK should still have the overall advantage, but the question is, how much of an advantage.
Disclaimer
Work on this exploratory project was sponsored by the folks over at ScyllaDB, Inc, the primary stewards of the open-source Seastar framework, and organizers of P99 CONF. After I spoke at P99 CONF last year, they contacted me to see if there were any areas of mutual interest that we could explore. My last experiment made me curious about doing a kernel vs DPDK showdown, and Seastar fit the bill perfectly, so this post is the result of that engagement. All technical discussions took place on their public Slack channel and mailing list.
Roadmap
This post is pretty long, so here is a high-level outline in case you want to jump to a particular area of interest.
Getting Started
DPDK Setup and Optimizations
Kernel Stack Optimizations
- Baseline Kernel Performance
- OS Level Optimizations
- Perfect Locality and Busy Polling (It took several tries to get this working)
- Constant Context Switching
- It is better to RECV
- Remember to flush
Results, Caveats, and Curiosities
The End
Clicking the menu icon at the top right will open a table of contents so that you can easily jump to a specific section.
Building Seastar
I had a bit of a challenge getting Seastar built initially. I wanted to use Amazon Linux 2 since I am pretty familiar with it, but it became clear that I was fighting a losing battle with outdated dependencies. I switched to vanilla CentOS 8 and managed to get it running despite a few issues, but I still didn't feel like I was on solid enough ground. After a brief dalliance with CentOS Stream 9, I asked for help in the public Slack channel, and I was pointed in the direction of Fedora 34 as the best OS for building the most recent version of the codebase.
I actually did most of my research and testing using Fedora 34 (kernel 5.15), but while Fedora may be great for its cutting-edge updates, sometimes the cutting edge becomes the bleeding edge. By the time I decided to start reproducing my results from scratch, I realized that the latest Fedora 34 updates were upgrading the kernel from 5.11 straight to version 5.16. Unfortunately kernel 5.16 triggered performance regression for my tests, so I needed an alternative.
As it turns out, Amazon Linux 2022 is based on Fedora 34, but has a more conservative kernel update policy, opting to stick with the 5.15 LTS release, so I chose AL 2022 as the new base OS for these tests, and in a bit of revisionist history, for the rest of the post I will just pretend like I was using it the whole time.
HTTP Server
I started out using Seastar's built-in HTTP Server (httpd) for my tests but I decided to go a level down from httpd to using a bare-bones TCP server that just pretends to be an HTTP server. The server just sends back a fixed HTTP response without doing any parsing or routing. This simplifies my analysis and highlights the effect of each change that I make more clearly. In particular I wanted to eliminate Seastar's built-in HTTP parser from the equation. Before I removed it, performance would vary significantly just based on how many HTTP headers the client sent. So rather than go down the rabbit hole of figuring out what was going on there, I decided to just cheat by using my simple tcp_httpd server instead.
Source Code
I opened a few PRs on the main Seastar repo based on the work I did for this project, but most of the changes aren't suitable for upstreaming given that they depend on epoll, and current development is now focused around aio and io_uring. All the patches used in this post are available in my Seastar repo on GitHub.
Benchmark Setup
This is a basic overview of the benchmark setup on AWS. I used the Techempower JSON Serialization test as the reference benchmark for this experiment.
Hardware
- Server: 4 vCPU c5n.xlarge instance
- Client: 16 vCPU c5n.4xlarge instance (the client becomes the bottleneck if I try to use a smaller instance size)
- Network: Server and client located in the same availability zone (use2-az1) in a cluster placement group
Software
- Operating System: Amazon Linux 2022 (kernel 5.15)
- Server: My simple tcp_httpd server:
sudo ./tcp_httpd --reactor-backend epoll - Client: I made a few modifications to wrk, the popular HTTP benchmarking tool, and nicknamed it twrk. twrk delivers more consistent results on short, low latency test runs. The standard version of wrk should yield similar numbers in terms of throughput, but twrk allows for improved p99 latencies, and adds support for displaying p99.99 latency.
Benchmark Configuration
I ran twrk manually from the client using the following parameters:
- No pipelining
- 256 connections
- 16 threads (1 per vCPU), with each thread pinned to a vCPU
- 1 second warmup before stats collection starts, then the test runs for 5s
twrk --latency --pin-cpus -H 'Host: server.tld' "http://172.31.XX.XX:8080/json" -t 16 -c 256 -D 1 -d 5
DPDK on AWS
Getting Seastar and DPDK working on AWS was no walk in the park. The DPDK documentation for the AWS ENA driver has improved significantly in recent times, but it was a little bit rougher when I started, and it was difficult to find working examples of using Seastar with DPDK. Thankfully, between assistance on the Slack channel and my stubborn persistence I was able to get things running.
Here are some of the highlights for those looking to do the same:
DPDK needs to be able to take over an entire network interface, so in addition to the primary interface for connecting to the instance via SSH (eth0/ens5), you will also need to attach a secondary interface dedicated to DPDK (eth1/ens6).
DPDK relies on one of two available kernel frameworks for exposing direct device access to user-land, VFIO or UIO. VFIO is the recommended choice, and it is available by default on recent kernels. By default, VFIO depends on hardware IOMMU support to ensure that direct memory access happens in a secure way, however IOMMU support is only available for *.metal EC2 instances. For non-metal instances, VFIO supports running without IOMMU by setting
enable_unsafe_noiommu_mode=1when loading the kernel module.Seastar uses DPDK 19.05, which is a little outdated at this point. The AWS ENA driver has a set of patches for DPDK 19.05 which must be applied to get Seastar running on AWS. I backported the patches to my DPDK fork for convenience.
Last but not least, I encountered a bug in the DPDK/ENA driver that resulted in the following error message:
runtime error: ena_queue_start(): Failed to populate rx ring. This issue was fixed in the DPDK codebase last year so I backported the change to my DPDK fork.
Using the tcp_httpd app, I ran my benchmark with DPDK as the underlying network stack: sudo ./tcp_httpd --network-stack native --dpdk-pmd
Running 5s test @ http://172.31.12.71:8080/json
  16 threads and 256 connections
  Thread Stats   Avg     Stdev       Max       Min   +/- Stdev
    Latency   205.32us   36.57us    1.34ms   62.00us   69.36%
    Req/Sec    74.80k     1.81k    77.85k    69.06k    73.85%
  Latency Distribution
  50.00%  204.00us
  90.00%  252.00us
  99.00%  297.00us
  99.99%  403.00us
  5954189 requests in 5.00s, 0.86GB read
Requests/sec: 1190822.80
DPDK performance clocks in at an impressive 1.19M req/s right out of the gate.
Initial Flame Graph
Flame Graphs provide a unique way to visualize CPU usage and identify your application's most frequently used code-paths. They are a powerful optimization tool, as they allow you to quickly identify and eliminate bottlenecks. Clicking the image below will open the original SVG file that was generated by the Flamegraph tool. These SVGs are interactive. You can click a segment to drill down for a more detailed view, or you can search (Ctrl + F or click the link at the top right) for a function name. Note that each complete flame graph captures four near-identical stacks representing the 4 reactor threads (one per vCPU), but throughout the post we will mostly focus on analyzing the data for a single reactor/vCPU.

Flame Graph Analysis
A quick look at the flame graph is enough to see that the eth_ena_xmit_pkts function looks suspiciously large, weighing in at 53.1% of the total flame graph.
DPDK Optimization
On 5th+ generation instances the ENA hardware/driver supports a LLQ (Low Latency Queue) mode for improved performance. When using these instances, it is strongly recommended that you enable the write combining feature of the respective kernel module (VFIO or UIO), otherwise, performance will suffer due to slow PCI transactions.
The VFIO module doesn't support write combining by default, but the ENA team provides a patch and a script to automate the process of adding WC support to the kernel module. I originally had a couple issues getting it working with kernel 5.15 but the ENA team was pretty responsive about getting them fixed. The team also recently indicated they intend to upstream the VFIO patch which will hopefully make things even more painless in the future.
Running 5s test @ http://172.31.12.71:8080/json
  16 threads and 256 connections
  Thread Stats   Avg     Stdev       Max       Min   +/- Stdev
    Latency   153.79us   31.63us    1.43ms   52.00us   68.70%
    Req/Sec    95.18k     2.31k   100.94k    89.75k    68.88%
  Latency Distribution
  50.00%  152.00us
  90.00%  195.00us
  99.00%  233.00us
  99.99%  352.00us
  7575198 requests in 5.00s, 1.09GB read
Requests/sec: 1515010.51
Enabling write combining brings performance from 1.19M req/s to 1.51M req/s, a 27% performance increase.

Flame Graph Analysis
Our flame graph now looks a lot more balanced and eth_ena_xmit_pkts has dropped from 53.1% of the flame graph to a mere 6.1%.
A Tall Order
DPDK has thrown down the gauntlet with an absolutely massive showing. 1.51M requests per second on a 4 vCPU instance is HUGE. Can the kernel even get close?
Baseline Kernel Performance
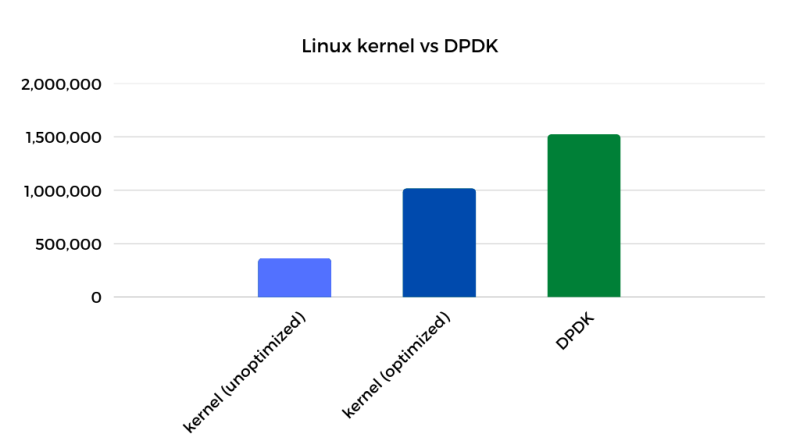
Starting with an unmodified AL 2022 AMI, tcp_httpd performance starts out at around 358k req/s. In absolute terms this is really, really fast, but it is underwhelming by comparison.
Running 5s test @ http://172.31.XX.XX:8080/json
  16 threads and 256 connections
  Thread Stats   Avg     Stdev       Max       Min   +/- Stdev
    Latency   711.06us   97.91us    1.65ms  108.00us   70.06%
    Req/Sec    22.48k   205.46     23.10k    21.83k    68.62%
  Latency Distribution
  50.00%  696.00us
  90.00%    0.85ms
  99.00%    0.96ms
  99.99%    1.10ms
  1789658 requests in 5.00s, 264.55MB read
Requests/sec: 357927.16

OS Level Optimizations
I won't go into a lot of detail about the specific Linux changes that I made. At a high level, the changes are very similar in nature to the tweaks that I made to Amazon Linux 2/kernel 4.14 in my previous post. That being said, there was actually a significant performance regression for this workload going from kernel 4.14 and 5.15, and it took quite a bit of work to get performance back up to par. But I want to stay focused on the kernel vs DPDK comparison for now, so I will save those details for another day, and another post. Here is a high-level overview of the OS optimizations used:
- Disable Speculative Execution Mitigations
- Configure RSS and XPS for perfect locality
- Interrupt Moderation and Busy Polling
- Disable Raw/Packet Sockets (FYI it wasn't quite the same nosy neighbor this time around)
- GRO, Congestion Control, and Static Interrupt Moderation
- A handful of new optimizations
Our OS optimizations took throughput from 358k req/s to a whopping 726k req/s. A solid 103% performance improvement.
Running 5s test @ http://172.31.XX.XX:8080/json
  16 threads and 256 connections
  Thread Stats   Avg     Stdev       Max       Min   +/- Stdev
    Latency   346.76us   86.26us    1.51ms   62.00us   72.62%
    Req/Sec    45.61k     0.88k    48.82k    42.50k    70.15%
  Latency Distribution
  50.00%  347.00us
  90.00%  455.00us
  99.00%  564.00us
  99.99%  758.00us
  3630818 requests in 5.00s, 536.71MB read
Requests/sec: 726153.58

Perfect Locality and Busy Polling
The OS level changes to enable perfect locality/busy polling don't really have much effect until the application is properly configured as well. My next step was to add SO_ATTACH_REUSEPORT_CBPF support to my Seastar fork so that the perfect locality setup would be complete.
Running 5s test @ http://172.31.XX.XX:8080/json
  16 threads and 256 connections
  Thread Stats   Avg     Stdev       Max       Min   +/- Stdev
    Latency   338.93us   90.62us    1.56ms   61.00us   68.11%
    Req/Sec    46.57k     2.67k    54.00k    40.32k    64.29%
  Latency Distribution
  50.00%  330.00us
  90.00%  466.00us
  99.00%  562.00us
  99.99%  759.00us
  3706485 requests in 5.00s, 547.89MB read
Requests/sec: 741286.62
Throughput moved from 736k req/s to an underwhelming 741k req/s. A 2% performance bump was way below my expectations for this change.

Flame Graph Analysis
The flame graph shows zero evidence of busy polling. Perfect locality and busy polling work together in a virtuous cycle, so the lack of busy polling is a strong indicator that something is wrong with our setup. Perfect locality requires the OS and application to be configured so that once a network packet arrives on a given queue, all further processing is handled by the same vCPU/queue silo for both incoming and outgoing data. This means the order in which processes/threads are started, and the CPUs to which they are pinned must be controlled.
Perfect Locality and Busy Polling: Take two
I created a bftrace script to take a closer look at what was actually going on. The script attaches kprobes to reuseport_alloc() and reuseport_add_sock() to track the process/thread startup order and cpu affinity. The results immediately showed the problem. Even though the reactor threads are started sequentially (tcp_httpd/reactor-0, reactor-1, reactor-2, reactor-3), the CPU pinning is out of order (0, 2, 1, 3).
tcp_httpd, cpu=0, socket 0
reactor-1, cpu=2, socket 1
reactor-2, cpu=1, socket 2
reactor-3, cpu=3, socket 3
Further investigations revealed that Seastar uses hwloc to understand the hardware topology and optimize accordingly. But the default CPU allocation strategy is not optimal for our use case, so after raising the issue on the mailing list, I added a function to my fork that exposes the mapping between reactor shard ids and cpu ids to apps that build on Seastar.
I modified tcp_httpd to ensure that the cpu ids and socket ids matched. This resulted in the expected output from my bpftrace script.
tcp_httpd, cpu=0, socket 0
reactor-2, cpu=1, socket 1
reactor-1, cpu=2, socket 2
reactor-3, cpu=3, socket 3
Performance improves slightly, but still leaves a lot to be desired.
Running 5s test @ http://172.31.XX.XX:8080/json
  16 threads and 256 connections
  Thread Stats   Avg     Stdev       Max       Min   +/- Stdev
    Latency   317.99us   74.65us    1.39ms   78.00us   76.29%
    Req/Sec    49.51k     2.01k    54.74k    44.35k    68.88%
  Latency Distribution
  50.00%  312.00us
  90.00%  405.00us
  99.00%  531.00us
  99.99%  749.00us
  3938893 requests in 5.00s, 582.25MB read
Requests/sec: 787768.20
A 6% performance improvement this time, but still well below expectations.

Flame Graph Analysis
The flame graph doesn't show much in the way of change either, and there is still no busy polling happening, so something else is wrong. I dug into my bag of performance analysis tools to see if I could figure out what else was going on.
Impatiently Waiting
I was able to use libreactor as a point of reference for how a fully optimized epoll-based HTTP server should behave, and contrast that against tcp_httpd. Running a 10 second syscount trace (syscount -d 10) while the benchmark ran for both libreactor and tcp_httpd produced some enlightening results:
libreactor
SYSCALL                   COUNT
recvfrom                9755167
sendto                  9353652
epoll_wait               754685
read                         94
bpf                          43
newfstatat                   18
ppoll                        11
pselect6                      7
futex                         5
write                         5
tcp_httpd
SYSCALL                   COUNT
epoll_pwait             7525419
read                    7272935
sendto                  6926720
epoll_ctl                824992
poll                      76612
timerfd_settime           34276
rt_sigprocmask            11356
ioctl                      6447
membarrier                 5676
newfstatat                   18
For libreactor, the top two syscalls were send/recv with epoll_wait coming in at a distant third. Conversely with tcp_httpd, epoll_pwait was the number one syscall. This was a pretty good indicator that I needed to take a look at how epoll_pwait was called in the Seastar codebase.
The epoll_pwait syscall waits for events associated with file descriptors. In our case, we are dealing with socket file descriptors (representing a TCP connection) specifically, and each event indicates readiness to send or receive data.
The original epoll_(p)wait syscall can be thought of as taking 3 types of values for the timeout parameter
- -1: The syscall waits indefinitely for an event
- 0: The syscall returns immediately whether or not any events are ready
- n: The syscall waits until either a file descriptor delivers an event or n milliseconds have passed
libreactor uses a relatively simple reactor engine built entirely around epoll, so it can afford to wait indefinitely for the next event. Seastar, on the other hand, is a bit more sophisticated. Seastar supports a number of different high-resolution timers, poll functions, and cross-reactor message queues; and it tries to enforce certain guarantees about how long tasks are expected to run. Within the main do_run loop, Seastar calls epoll_pwait with a timeout of 0 (it doesn't wait at all), which is why we are not seeing any busy polling happen. Calling epoll_pwait with an indefinite timeout is a non-starter for Seastar, and even calling it with the epoll_pwait minimum value of 1ms is probably a little too long. This is demonstrated by the fact that Seastar's default value for how long tasks should run in a single cycle (task-quota-ms) is 0.5 (500us).
In order to strike a balance between the framework's latency expectations and my performance goals, I decided to make use of the relatively new epoll_pwait2 syscall. epoll_pwait2 is equivalent to epoll_pwait, but the timeout argument can be specified with nanosecond resolution. I settled on a timeout value of 100us as a good balance between performance and latency guarantees. The new syscall is available as of kernel 5.11 but the corresponding glibc wrapper isn't available until glibc 2.35, and Amazon Linux 2022 ships with glibc 2.34. To work around that, I hacked up a wrapper function named epoll_pwait_us, and I updated my Seastar fork to call it with a value of 100.
Running 5s test @ http://172.31.XX.XX:8080/
  16 threads and 256 connections
  Thread Stats   Avg     Stdev       Max       Min   +/- Stdev
    Latency   273.38us   39.11us    1.37ms   79.00us   71.32%
    Req/Sec    57.48k   742.64     59.34k    55.62k    67.98%
  Latency Distribution
  50.00%  271.00us
  90.00%  322.00us
  99.00%  378.00us
  99.99%  613.00us
  4575332 requests in 5.00s, 676.32MB read
Requests/sec: 915053.04
Performance moves from 788k req/s to 915k req/s, a solid 16% jump. Now we're cooking!

Flame Graph Analysis
Looking at the flame graph you can clearly see that busy polling has finally kicked in, and looking at our syscall count we see the expected pattern emerge.
tcp_httpd
SYSCALL                   COUNT
read                    8422317
sendto                  7964784
epoll_ctl                450827
epoll_pwait2             375947
poll                      79836
ioctl                       202
bpf                          49
newfstatat                   18
ppoll                        11
Constant Context Switching
I continued comparing tcp_httpd to libreactor using a few more perf tools to see if I could pick up any more anomalies. Sure enough, using sar -w 1 to monitor context switches produced some eyebrow raising numbers for tcp_httpd.
libreactor
01:13:50 AM    proc/s   cswch/s
01:13:57 AM      0.00    277.00
01:13:58 AM      0.00    229.00
01:13:59 AM      0.00    290.00
01:14:00 AM      0.00    340.00
tcp_httpd
01:03:03 AM    proc/s   cswch/s
01:03:04 AM      0.00  17132.00
01:03:05 AM      0.00  17060.00
01:03:06 AM      0.00  17048.00
01:03:07 AM      0.00  17026.00
Looking at the flame graph without zooming in I noticed that for each reactor thread, Seastar creates a matching timer thread named timer-0, timer-1, etc. At first I didn't pay much attention to them since I wasn't explicitly setting any timers, and they were barely visible on the flame graph, but in light of the context switching numbers I decided to take a closer look.
For each reactor/cpu core, start_tick() starts a thread using the task_quota_timer_thread_fn() function. The function waits for the reactor's _task_quota_timer to expire and then interrupts the main thread by calling request_preemption(). This is done to make sure that the tasks on the main thread don't hog resources by running for more than X ms without preemption. But for our specific workload, it causes excessive context switching and tanks performance. What we want to do is set it just long enough so that reactor::run_some_tasks() can complete all tasks and reset preemption without ever being interrupted. It should be noted that Seastar's default aio backend seems to make use of some aio specific preempting functionality to handle the task quota, so this particular behavior is limited to the epoll backend.
Seastar allows users to pass in a value to set the --task-quota-ms via the command line. The default value is 0.5, but I found 10ms to be a more reasonable value for this workload.
tcp_httpd with --task-quota-ms 10
01:04:58 AM    proc/s   cswch/s
01:04:59 AM      0.00   1327.00
01:05:00 AM      0.00   1303.00
01:05:01 AM      0.00   1339.00
01:05:02 AM      0.00   1296.00
The number of context switches per second dropped dramatically from 17k to 1.3k
Running 5s test @ http://172.31.XX.XX:8080/json
  16 threads and 256 connections
  Thread Stats   Avg     Stdev       Max       Min   +/- Stdev
    Latency   259.14us   29.51us    1.51ms   77.00us   71.92%
    Req/Sec    60.55k   532.97     61.77k    58.82k    66.71%
  Latency Distribution
  50.00%  257.00us
  90.00%  296.00us
  99.00%  337.00us
  99.99%  557.00us
  4820680 requests in 5.00s, 712.59MB read
Requests/sec: 964121.54
Throughput moved from 915k req/s to 964k req/s, a 5.3% improvement.

Flame Graph Analysis
The change in the flame graph is pretty subtle. If you zoom out to the "all" view and then search for timer- you will see a small section to the far right go from 0.7% of the previous flame graph to 0.1% of the current one. Flame graphs are extremely useful but they don't always capture the performance impact in a proportional way. Sometimes you have to rummage around in your perf toolbox to find the right tool to pick up an anomaly.
It is better to RECV
This is a simple fix that I figured out back when I was optimizing libreactor. When working with sockets, it is a little more efficient to use Linux's recv/send functions, than the more general-purpose read/write. Generally the difference is negligible, however when you move beyond 50k req/s it starts to add up. Seastar was already using send for outgoing data, but it was using read for incoming requests, so I made the relatively simple change to switch it to recv instead.
Running 5s test @ http://172.31.XX.XX:8080/json
  16 threads and 256 connections
  Thread Stats   Avg     Stdev       Max       Min   +/- Stdev
    Latency   253.53us   30.51us    1.21ms   93.00us   74.63%
    Req/Sec    61.72k   597.21     62.99k    58.46k    71.81%
  Latency Distribution
  50.00%  250.00us
  90.00%  291.00us
  99.00%  342.00us
  99.99%  652.00us
  4911503 requests in 5.00s, 726.02MB read
Requests/sec: 982287.44
Throughput moved from 964k req/s to 982k req/s, just under a 2% performance improvement.

Flame Graph Analysis
If you look at the read/recv stack on the left side of the flame graph you will see that __libc_recv gets to the point a lot more directly than __libc_read.
Remember to Flush
I found the final optimization by roaming around the codebase and switching things on/off to see what they did. When using the epoll reactor backend, the batch_flushes option on output_stream defers calling send() right away when flush() is called. It is designed as an optimization for RPC workloads that may call flush() multiple times, but it doesn't provide any benefit for our simple request/response workload. As a matter of fact, it adds a little bit of overhead, so as a quick fix I just disabled batch_flushes.
Running 5s test @ http://172.31.XX.XX:8080/json
  16 threads and 256 connections
  Thread Stats   Avg     Stdev       Max       Min   +/- Stdev
    Latency   246.66us   34.32us    1.25ms   61.00us   74.07%
    Req/Sec    63.30k     0.88k    65.72k    61.63k    66.84%
  Latency Distribution
  50.00%  246.00us
  90.00%  288.00us
  99.00%  333.00us
  99.99%  436.00us
  5038933 requests in 5.00s, 744.85MB read
Requests/sec: 1007771.89
Throughput moved from 982k req/s to 1.0M req/s, a 2.2% performance boost.

Flame Graph Analysis
The flame graph shows that the send stack moved from batch_flush_pollfn::poll to output_stream<char>::flush
Our optimization efforts have rewarded us with a psychologically satisfying base 10 number for our final figure: 1.0M request/s using nothing more than the good old Linux kernel.
And the winner is...
In the end, DPDK still maintains a solid 51% percent performance lead over the kernel. Whether that is a lot or a little depends on your perspective. The way I look at it, when you compare the unoptimized and optimized versions of the kernel/application, we have narrowed DPDK's performance advantage from 4.2x to just 1.5x.
DPDK Caveats
DPDK's 51% advantage is nothing to scoff at, however I would be remiss if I sent you down a DPDK rabbit hole without adding some disclaimers about DPDK's challenges.
To start, it is a bit of a niche technology, so finding articles and examples online (especially for use-cases outside established areas) can be challenging.
Bypassing the kernel means you also bypass its time-tested TCP stack. If your application uses a TCP based protocol like HTTP, you need to provide your own TCP networking stack in userspace. There are frameworks like Seastar and F-Stack that help, but migrating your application to them may be non-trivial.
Working with a custom framework might also mean that you are tied to the specific DPDK version that it supports, which might not be the version supported by your network driver or kernel.
In bypassing the kernel you also bypass a rich ecosystem of existing tools and features for securing, monitoring and configuring your network traffic. Many of the tools and techniques that you are accustomed to no longer work.
If you use poll-mode processing your CPU usage will always be 100%. In addition to not being energy efficient/environmentally friendly, it also makes it difficult to quickly assess/troubleshoot your workload using CPU usage as a gauge.
DPDK based applications take full control of the network interface, which means:
- You must have more than one interface.
- If you want to modify device settings, you have to do it before startup, or through the application.
- If you want to capture metrics, the application has to be configured to do it; it is much harder to troubleshoot on the fly.
That being said, there may be reasons to pursue a custom TCP/IP stack other than pure performance. An in-application TCP stack allows the application to precisely control memory allocation (avoiding contention for memory between the application and kernel) and scheduling (avoiding contention for CPU time). This can be important for applications that strive not only for maximum throughput, but also for excellent p99 latency.
At the end of the day it is about balancing priorities. As an example, even though the ScyllaDB team occasionally gets reports of reactor stalls related to the kernel network stack, they still choose to stick with the kernel for their flagship product, because switching to DPDK would be far from a simple undertaking.
Speculative Execution Mitigations
Early on in this post I glossed over the OS level optimizations that I made before I started optimizing the application. From a high level the changes were similar to my previous post, and for those who want to dig into more details, I plan to write up a kernel 4.14 vs 5.15 post "at some point". Nevertheless there is one particular optimization that deserves further analysis in this kernel vs DPDK showdown: disabling speculative execution mitigations.
I won't rehash my opinion on these mitigations, you can read it here. For the purposes of this post, I turned them off, but if you look at the graph below you will see that turning them back on shows some interesting results.
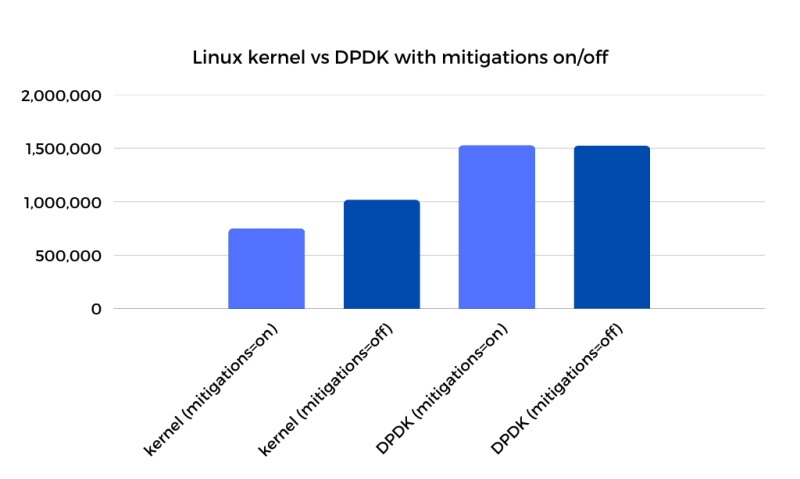
As you can see, while disabling mitigations yields a 33% performance improvement on the kernel side, it had zero impact on DPDK performance. This leads to two main takeaways:
For environments where speculative execution mitigations are a must, DPDK represents an even bigger performance improvement over the kernel TCP stack.
Kernel technologies like io_uring that bypass the syscall interface for I/O have even greater potential for improving performance on the majority of workloads.
Most people don't disable Spectre mitigations, so solutions that work with them enabled are important. I am not 100% sure that all of the mitigation overhead comes from syscalls, but it stands to reason that a lot of it arises from security hardening in user-to-kernel and kernel-to-user transitions. The impact is certainly visible in the syscall related functions on the flame graph.

Conclusion
We have demonstrated that even when the OS and application are optimized to the extreme, DPDK still has a 51% performance lead over the kernel networking stack. Instead of seeing that difference as an insurmountable hurdle, I see the gap as unrealized potential on the kernel side. The gap simply raises the question: To what extent can the Linux kernel be further optimized for thread-per-core applications without compromising its general-purpose nature?
DPDK gives us an idea of what is possible under ideal circumstances, and serves as a target to strive towards. Even if the gap can't fully be closed, it quantifies the task and throws the obstacles into sharper focus.
One very obvious obstacle is the overhead of the syscall interface when doing millions of syscalls per second. Thankfully, io_uring seems to offer a potential solution for that particular challenge. I have been keeping a close eye on io_uring, as it is still under pretty heavy development. I am particularly excited to see the recent wave of networking focused optimizations like busy poll support, recv hints, and even experimental explorations like lockless TCP support. It remains very high on my list of things to test "real soon".
Appendix
Special Thanks
Special thanks to my reviewers: Dor and Kenia, and to everyone on the Seastar Slack channel and mailing list, particularly Piotr, Avi and Max.
C/C++ Primers
I used my limited C knowledge, combined with basic pattern recognition to fumble around Seastar's C++ codebase for way longer than I probably should have, but when it came time to add the get_cpu_to_shard_mapping() function, I decided to stop fooling myself and learn a little C++. If you find yourself in a similar predicament, I recommend A Tour of C++ as a decent primer. If you need a quick C refresher as well, I recommend Essential C and Pointers and Memory.